
Query Monitor is the developer tools panel for WordPress. It enables debugging of database queries, PHP errors, hooks and actions, block editor blocks, enqueued scripts and stylesheets, HTTP API calls, and more.
It includes some advanced features such as debugging of Ajax calls, REST API calls, and user capability checks. It includes the ability to narrow down much of its output by plugin or theme, allowing you to quickly determine poorly performing plugins, themes, or functions.
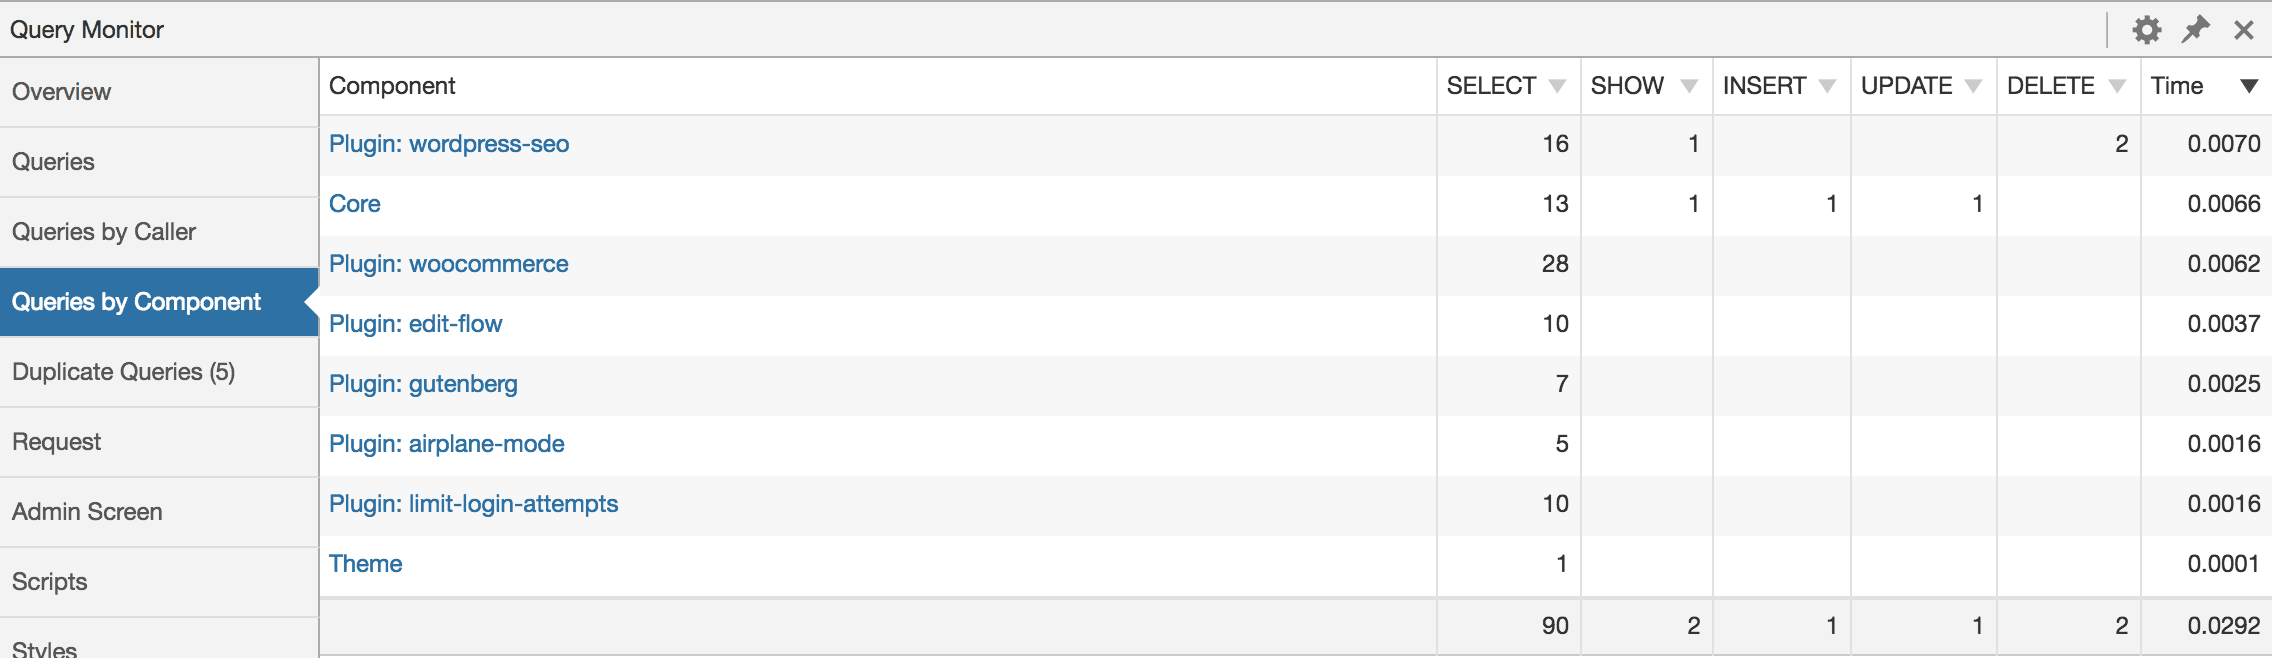
Query Monitor focuses heavily on presenting its information in a useful manner, for example by showing aggregate database queries grouped by the plugins, themes, or functions that are responsible for them. It adds an admin toolbar menu showing an overview of the current page, with complete debugging information shown in panels once you select a menu item.
Overview
of what’s shown for each page load:
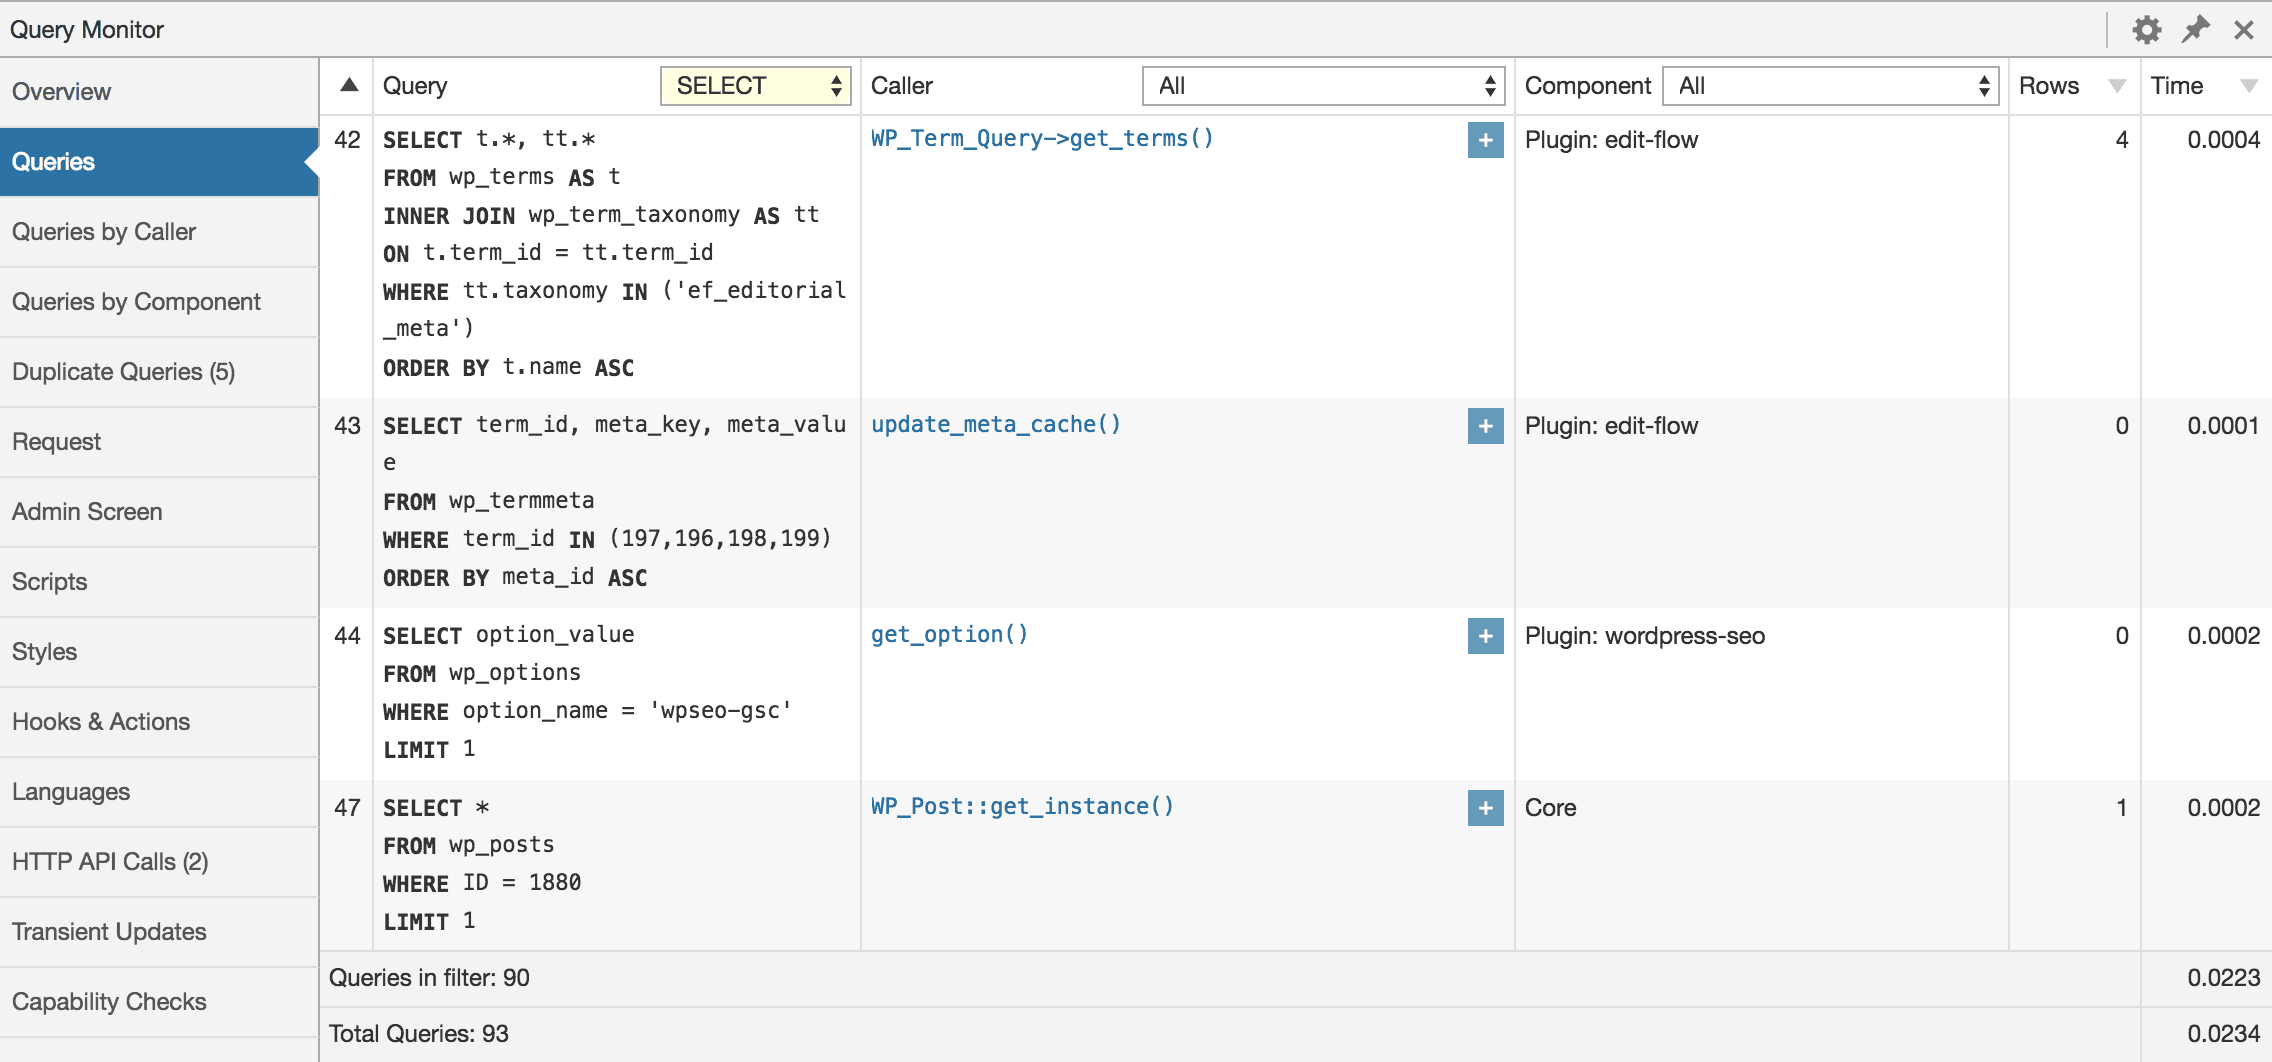
- Database queries, including notifications for slow, duplicate, or erroneous queries. Allows filtering by query type (
SELECT,UPDATE,DELETE, etc), responsible component (plugin, theme, WordPress core), and calling function, and provides separate aggregate views for each. - The template filename, the complete template hierarchy, and names of all template parts that were loaded or not loaded.
- PHP errors presented nicely along with their responsible component and call stack, and a visible warning in the admin toolbar.
- Blocks and associated properties in post content when using WordPress 5.0+ or the Gutenberg plugin.
- Matched rewrite rules, associated query strings, and query vars.
- Enqueued scripts and stylesheets, along with their dependencies, dependents, and alerts for broken dependencies.
- Language settings and loaded translation files (MO files) for each text domain.
- HTTP API requests, with response code, responsible component, and time taken, with alerts for failed or erroneous requests.
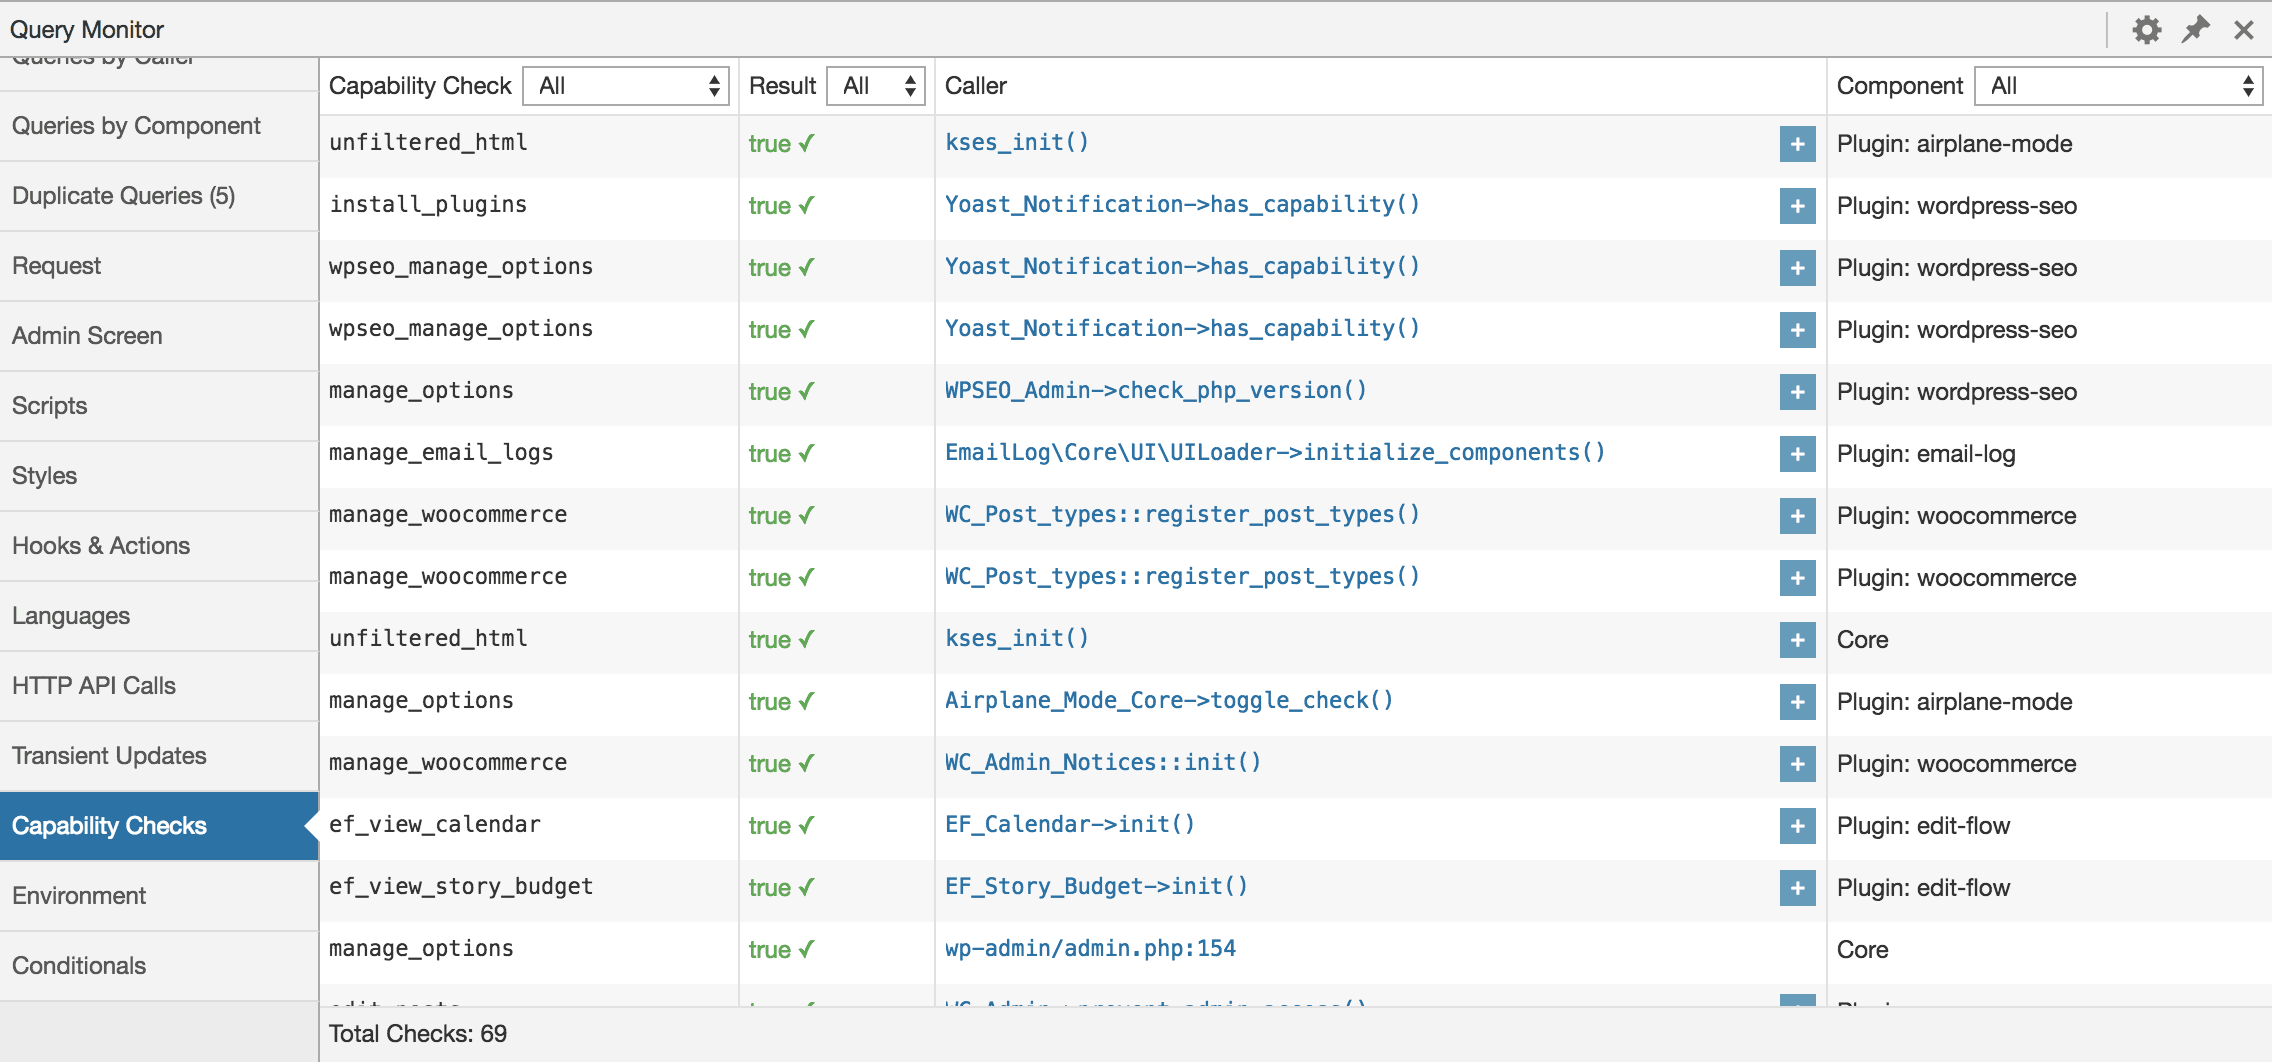
- User capability checks, along with the result and any parameters passed to the capability check.
- Environment information, including detailed information about PHP, the database, WordPress, and the web server.
- The values of all WordPress conditional functions such as
is_single(),is_home(), etc. - Transients that were updated.
In addition
- Whenever a redirect occurs, Query Monitor adds an HTTP header containing the call stack, so you can use your favourite HTTP inspector or browser developer tools to trace what triggered the redirect.
- The response from any jQuery-initiated Ajax request on the page will contain various debugging information in its headers. PHP errors also get output to the browser’s developer console.
- The response from an authenticated WordPress REST API request will contain various debugging information in its headers, as long as the authenticated user has permission to view Query Monitor’s output.
By default, Query Monitor’s output is only shown to Administrators on single-site installations, and Super Admins on Multisite installations.
In addition to this, you can set an authentication cookie which allows you to view Query Monitor output when you’re not logged in (or if you’re logged in as a non-Administrator). See the Settings panel for details.
Latest Update
On May 8, version 3.6.0 was released with
- Improvements to the UI when a fatal error occurs, including an admin toolbar warning.
- Improvements to the UI when QM is running in «broken» mode due to missing jQuery or an unrecoverable JavaScript error.
- Don’t display fatal errors if error display is off and the user cannot view QM.
- Improvements to the visual appearance of the
wp_die()output. - Simplify re-throwing a caught exception so QM doesn’t get the blame for fatal errors, eg. in the WordPress core fatal error handler.
- Add support for logging a variable of any type in the logger, as a replacement for var dumping.
- Don’t show a message for errors in Ajax calls that have already occurred on the main page load.
- Don’t dispatch QM during an iframed request, eg the plugin info modal or an upgrader action.
- Hide QM itself from various panels by default to remove noise. Can be controlled via the existing
QM_HIDE_SELFconfiguration constant. - Support for the new
is_favicon()conditional added in WP 5.4. - Fix the side panel resizing functionality.
- Add a WP-CLI command for creating the symlink to the db file.
- Add filters to
QM_Util::get_file_dirs()andget_file_component()to allow support for non-standard plugin and theme locations. - Add an action that fires when QM enqueues its assets, so add-on plugins can enqueue theirs only when necessary.
Privacy Statement
Query Monitor is private by default and always will be. It does not persistently store any of the data that it collects. It does not send data to any third party, nor does it include any third party resources.
Schreibe einen Kommentar